EDURAN NAVIGATOR

Quarterly Market review with outlook. Goldilocks environment and bull market entering final stage.
Zurich, 23.12.2017
Only a few days left until year end. Most likely 2017 won’t change to the worse and many investors will remember it a good year with most markets up much more than expected 12 months ago.
With hindsight 2017 has been a friendly year when looking at stock market returns. MSCI ACWI has returned roughly 20%, Europe generally slightly below, for instance SMI 14% and DAX 15%. US markets have been outperforming from this point of view for example, the Dow Jones up 25%. MSCI Emerging Markets and Nasdaq 100 were top with 30% gains, FTSE 100 (U.K.) on the other end up 5% only. Large caps over small and mid-caps is another take-away generally speaking for this year.
Markets have mainly been driven by a combination of still (too) low interest rates plus signals of an improving world economy (this being the first time for years across regions). One could speak of Goldilocks.
Interest rates
With years of lower interest rates there was a shift towards higher levels first time by the end of 2016 (10 yr rates). For 2017 long term rates mainly moved sideways, even when in a relatively wide range. The short-end saw a tightening which resulted in a flattening of the yield curve.
The Fed raised its benchmark rate as expected once more this December and one is expecting this to continue another 3 rate hike through the year of 2018. In Europe the tightening is lagging behind but in a manner still on track. Still there is no firm sign of inflation plus one could argue the market is in doubt we are not heading towards a next recession, hence longer term rates have come to a halt yet and so far.
Many market observers do not feel too complacent with a flatter yield curve, in fact it typically is a strong indicator for a recession to come. That said, one could argue with all the recent central banks activities such as lowering interest rates aggressively and for longer than ever before plus them buying into longer term bonds big time. All this has shaped the yield curve in a way it doesn’t reflect only market real capital flows any longer (the ECB keeps more than 2 trillion euros in bonds which is more than the total debt of Germany, Europe’s largest economy). In addition, recent regulation has made for instance insurance companies to invest in bonds which hardly return any positive yield or none (such bonds are earmarked as risk-free). When looking at increased debt of public institutions and states one could speak of financial repression going on. The private sector has also increased its debt burden. Some of the proceeds have even been used to buy back shares (or to pay dividends). Overall the quality labelling has deteriorated.
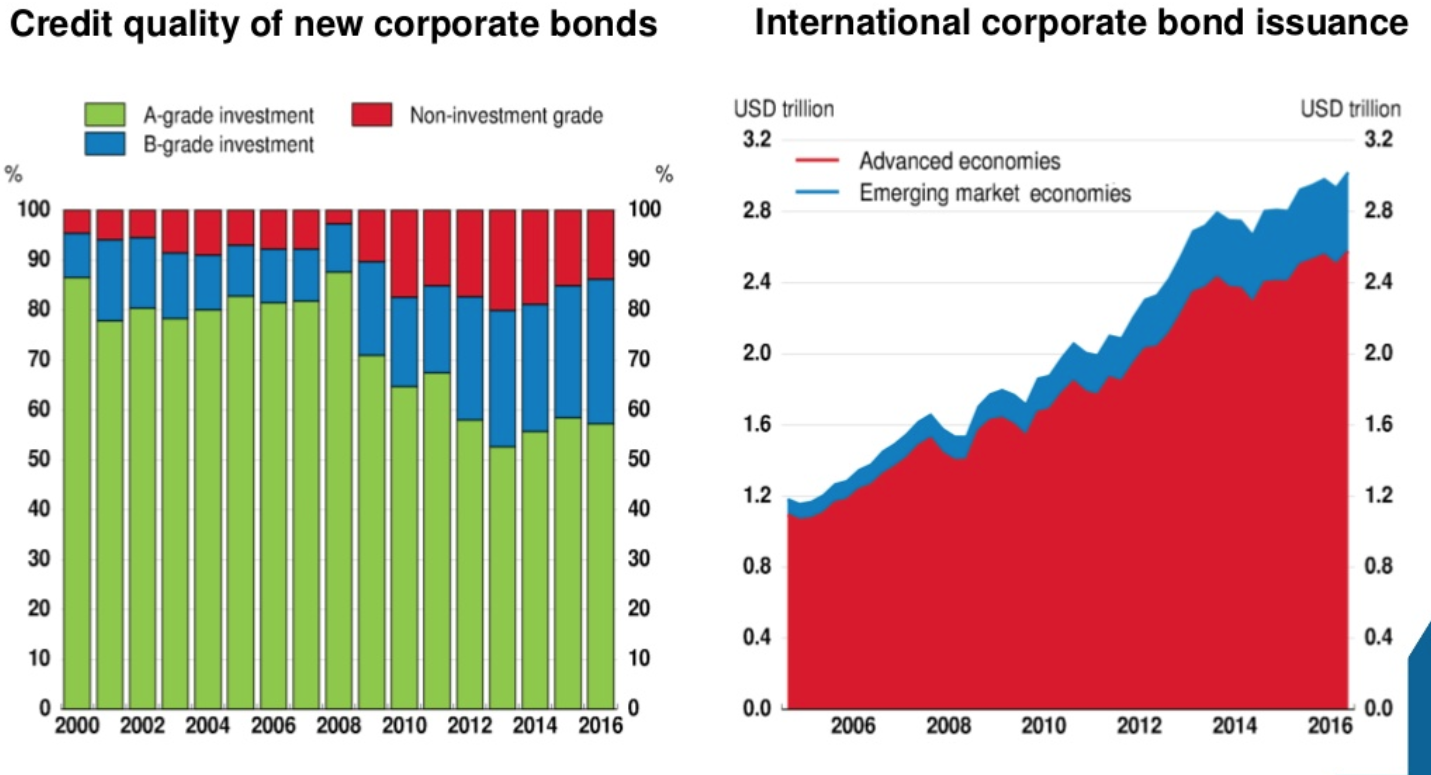
Corporate bonds issuance and quality / Source: OECD Business and Finance Scoreboard (left), Bank of International Settlements and OECD calculations (right)
As mentioned earlier a flattening of the yield curve (short vs longer term rates) has typically been followed by a remarkable decline in the stock markets.
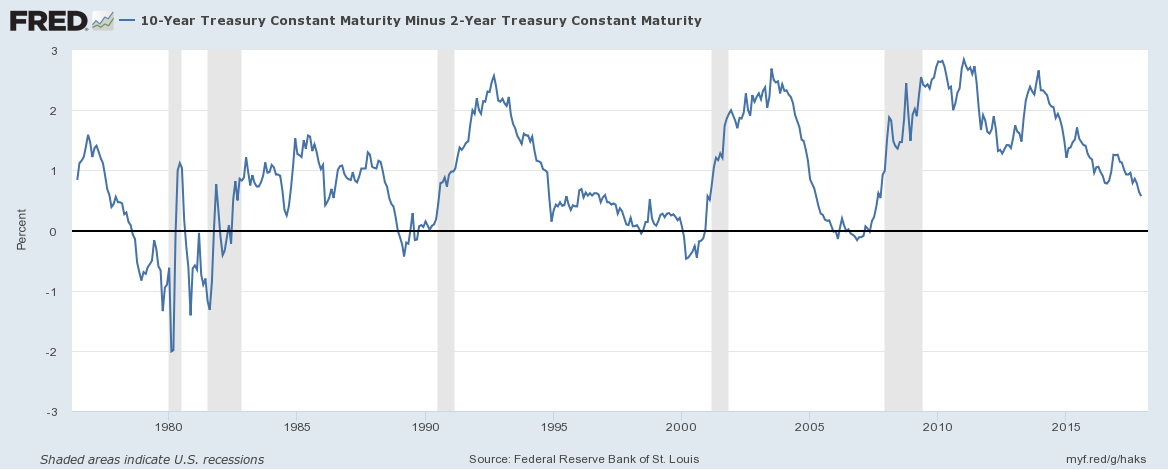
10yrs minus 2yrs US Treasury yield / Source: FRED, Federal Reserve Bank of St. Louis
If it is different this time we will all learn in the future. Central banks will try to normalize benchmark interest rates, close to the natural rate of interest. On the other hand governments should do what they didn’t for the past year: realize reforms to make money flow into private sector and investments instead of bureaucracy and overweight social welfare. Already now the lack of investments and missing interest income is weakening future demand and growth.
Companies
The global economy is supposed to grow 3.5% according to OECD which just took the estimate for year end up, revised from 3.3% in March. Most companies have surprised on the positive side when it comes to earnings, this Q3 again with roughly ¾ of all reportings being above what analysts expected. Compared to last year, Q3 earnings for the S&P are up 8.5%. PE ratio is round number 18.5 which is still above longer term average of 16. Many expect the world economy to expand going forward with most early indicators showing strong numbers. That said the goldilocks is likely to continue for the foreseeable future.
Looking at equity sectors tech stocks which have had a very good time for most part of the year followed by basic material and industrials. The more classic defensive stocks such as health care, consumer discretionary or telecom saw a bit more headwinds. In November however the momentum has changed slightly the latter have started to gain some traction. For the coming months we like the pharma sector with names which look attractive from a valuation point of view as well as from a technical point of view (e.g. Roche). With the U.S. tax reform small and mid caps are supposed to profit and hence with potential to catching up. Defensive stocks we like to add at any weakness in the markets.
Commodities too look interesting to us. The supply side has reduced overcapacity for the past years, predominantly for metals. Crude is a bit a special case with OPEC resolution curbing the output. No weakness on the demand side. Comparing commodities with equity levels the ration is very much on the lower end of the range, similar to end of 1970s or end of 1990. Goldmines, in particular small-cap ones, show strong balance sheets (according to RBC juniors show 11% debt vs 30% for seniors and CAGR is 11% again for juniors and 1% for seniors). For a insurance type of allocation this could be an option.
Technicals
Sentiment is positive which on the flip side goes with complacency. We might still not have hit levels of euphoria but there is not much risk premia to earn anymore. Looking at stock charts, here again S&P 500 as a leading benchmark, the current levels are key with resistance (or support) levels around 2615-2875 (fibonacci) as well as 2600-2550 (moving averages 90 resp. 50 days). Further accumulation of resistance is in the range of 3300-3700 (fibonacci). It is likely that the bull market comes to an halt latest at this resistance level above 3000. For the time being there still could be a correction, however, momentum is still on the way (slightly overbought though).
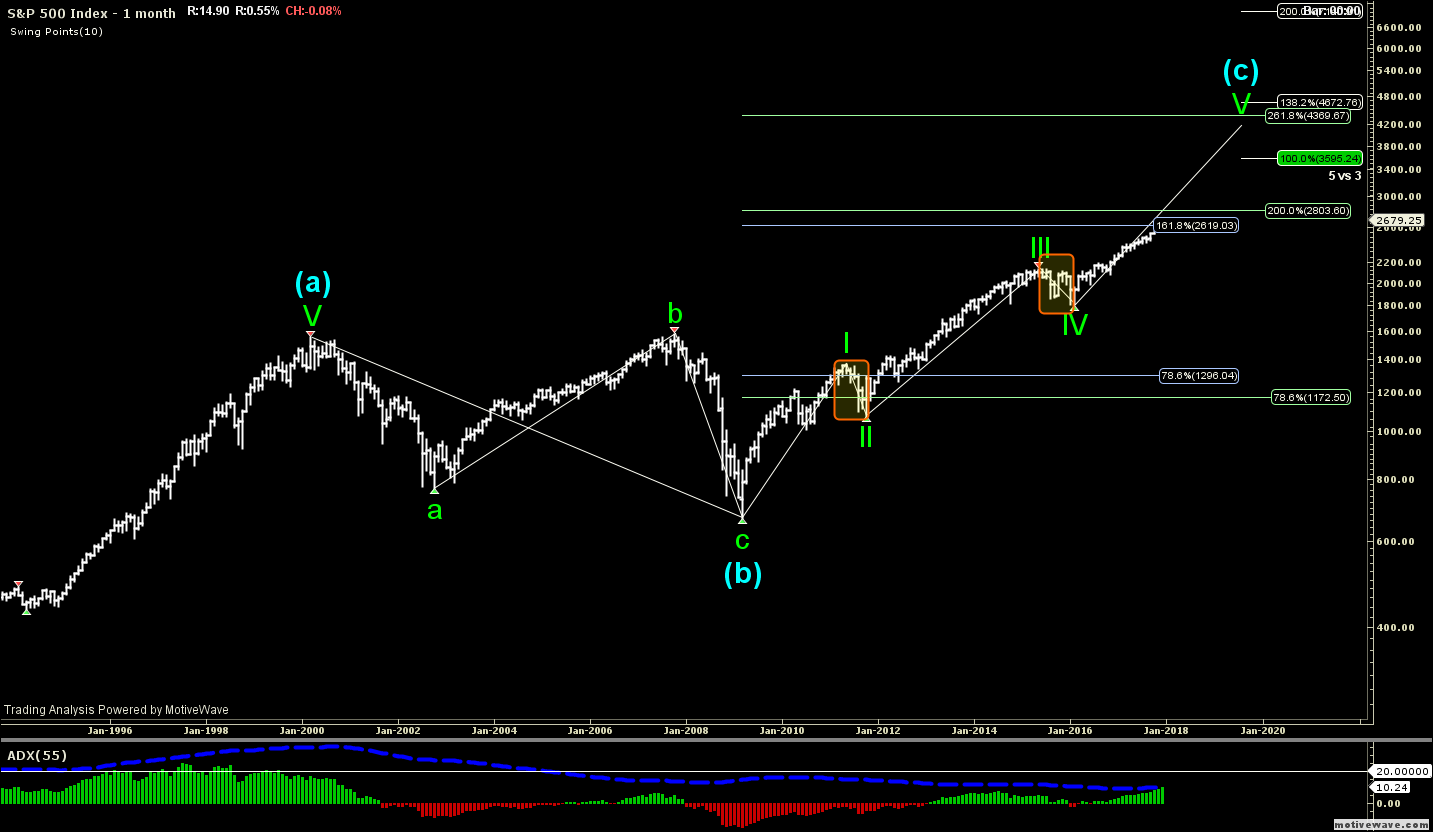
S&P500 monthly chart / Source: Eduran
Conclusion
What looks like a crystal ball on the picture is in fact, a frozen soap bubble. If markets are to burst any time soon is a difficult one as always. For sure when looking at stocks from either a valuation and a technical point of view neither makes it look very attractive to enter big time. The bull market appears to be a seasoned one in many aspects. That said we are still slightly overweight shares, implementing a natural hedge via uncorrelated exposure and still keeping on average a healthy cash portion (fixed income selectively). Many potential pitfalls on the road ahead volatility is likely to come back. Key will be the action of central banks, in particular the communication. Should inflation pick up (which it already does to some extend) it will make if more challenging, in particular when inflation surprises upwards.
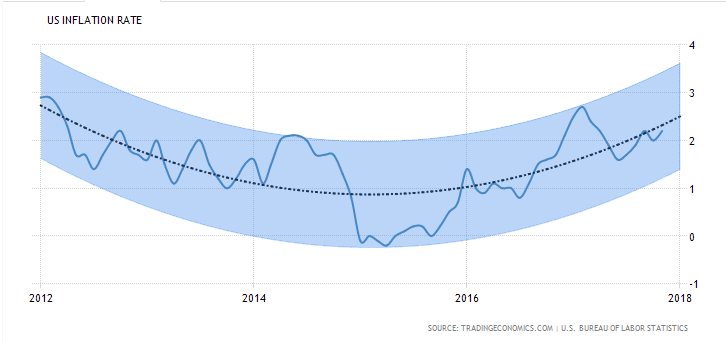
USA Inflation Rate Forecast / Source: U.S. Bureau of Statistics (tradingeconomics.com). Having a longer term strategy is very instrumental when manoeuvring through such an environment as well as how it could play out.
We wish you a happy holiday season and a happy new year!
EDURAN AG
Leave a Reply